Hi!
We measured the error curve of the MAQ600A (end-of-shaft mounted) compared to a high-resolution optical encoder.
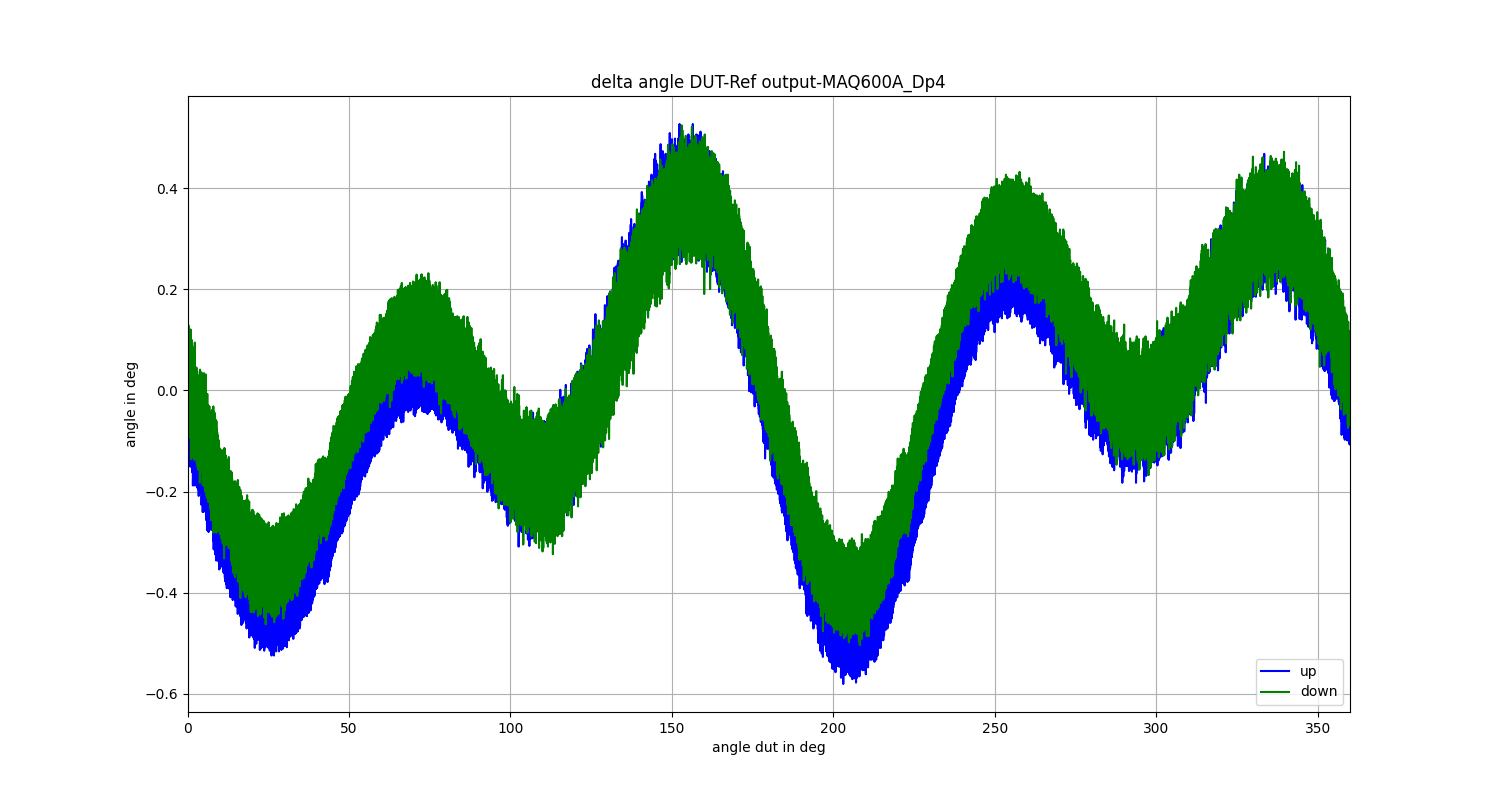
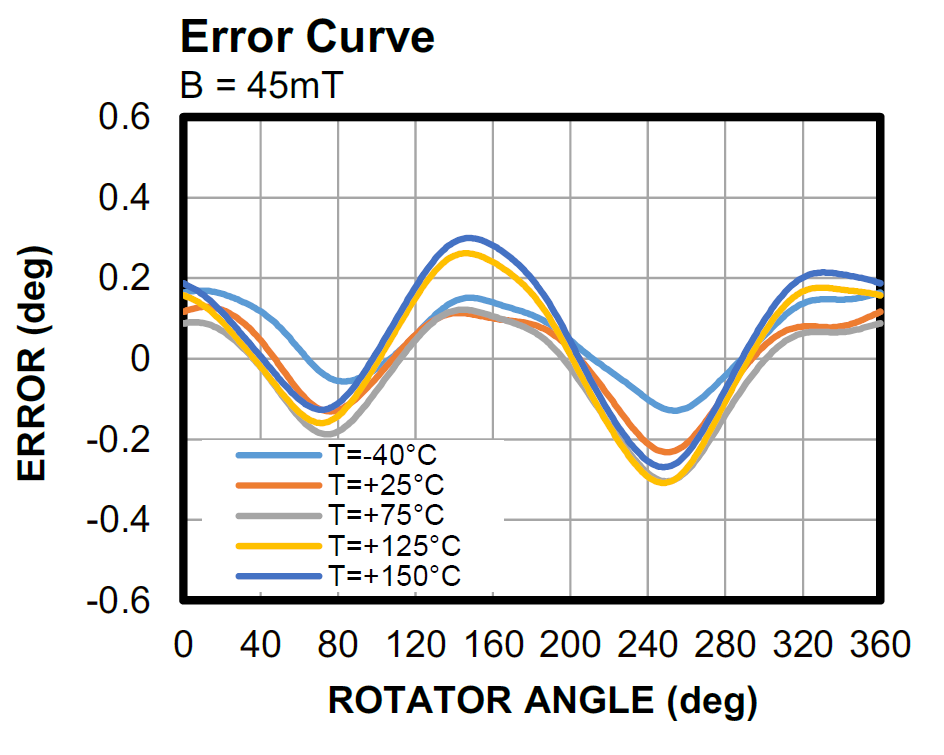
Unfortunately, the curve does not correspond to the one shown in the data sheet. We get 4 local maxima and minima. The curve in the data sheet has 2 each.
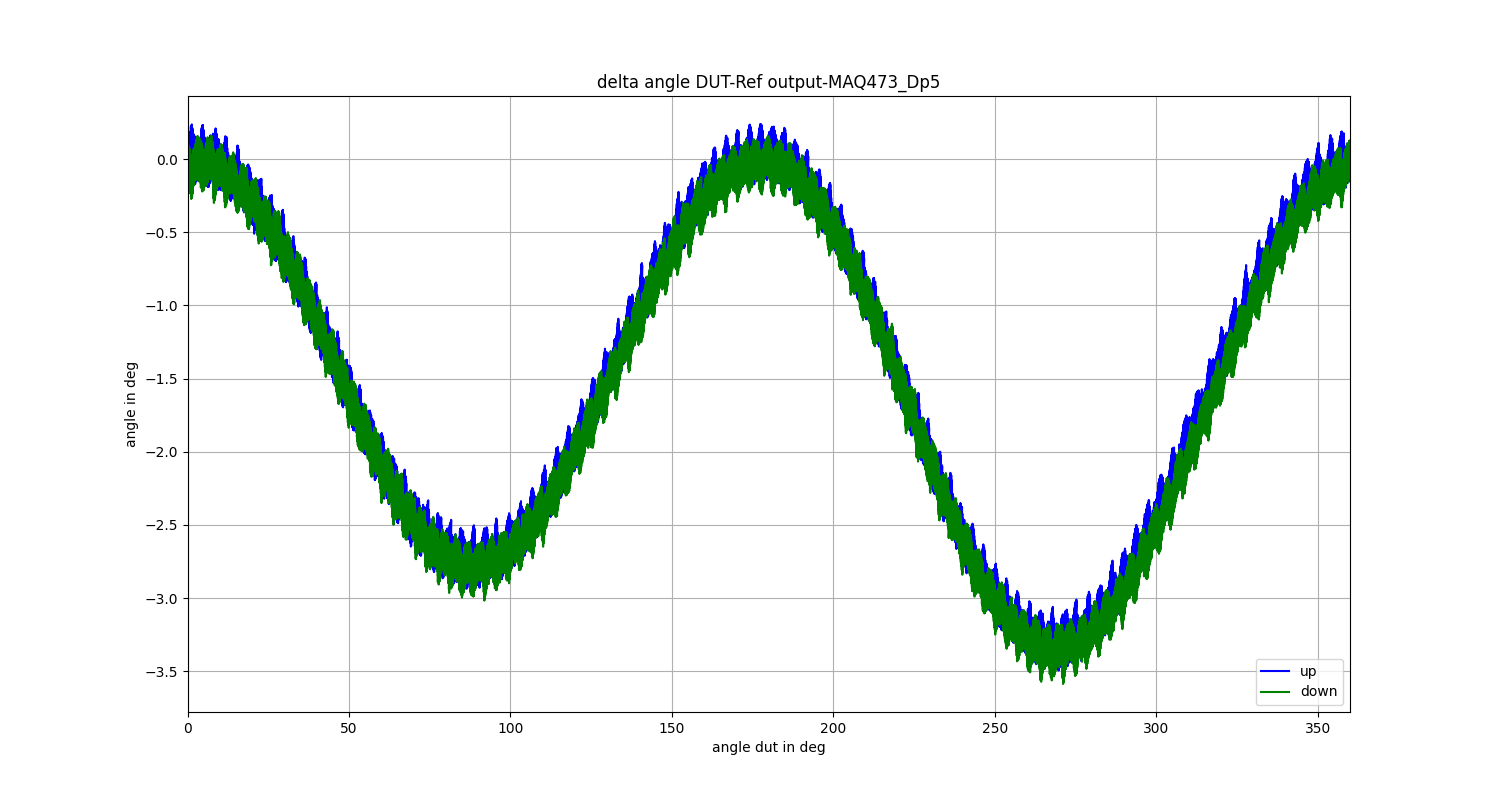
We also measured the MAQ473 with the same setup. In this case the shape corresponds to the illustration in the data sheet.
Is the shape deviation of the MAQ600A caused by normal sensor behaviour, or should we investigate further? Is there a probable explanation for the discrepancy?
Measurement MAQ600A:
Datasheet MAQ600A:
Measurement MAQ473:
Best regards,
Bernhard
Hello Bernhard,
Can you please share more information about your setup, i.e. magnet material and dimensions and the sensor position?
Kind regards,
Carmine
Hello Carmine!
I’m sorry for the late reply. Unfortunately, I haven’t received a notification regarding your reply.
Magnet data according to datasheet:
Tolerances : DIN ISO 2768-1m (Website Download Center)
ROHs(2011/65/EU+2015/863/EU)+EU-POP-Nr.2019/1021
Outer diameter(D) = 6 mm ()
Height(H) = 2.5 mm ()
Material/grade: NdFeB / 38SH / 303kJ/m3
Coating: Nickel
Poles: dia
max.operation temperature = 150°C
Flux density inside the magnet = 1.22 Tesla
Temperature coefficient and flux = 0.11% per 1°K
Dead weight: 0.5 g
Holding force on iron 2.35 Newton
Weight, which the magnet can lift: 0.24 kg
Air gap: approx. 1.5 mm
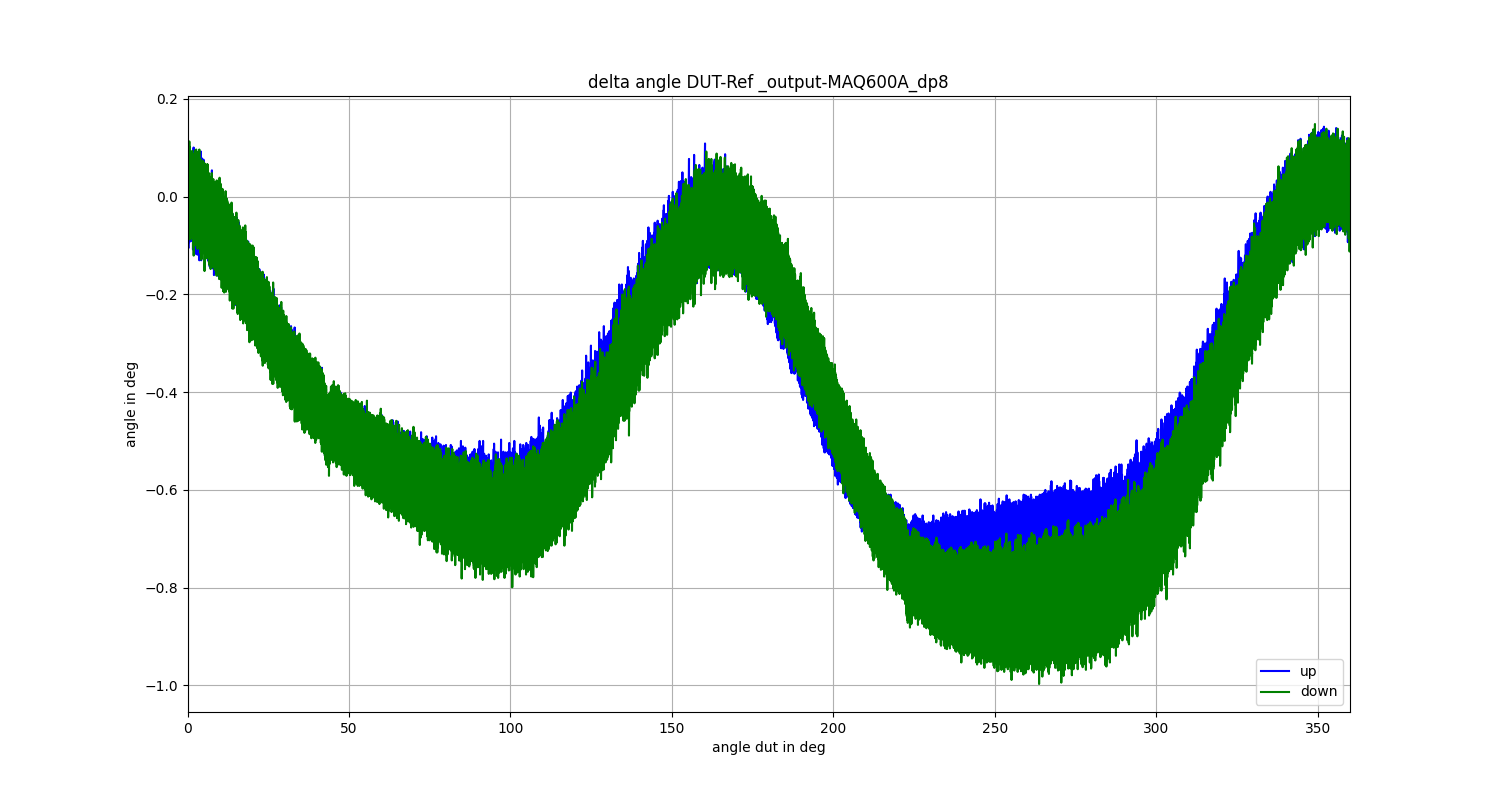
It looks like the air gap was too small and we were outside the linear region. With an air gap of 2.5 mm the result looks like the error curve in the datasheet.
Best regards,
Bernhard